Prometheus: The angel-eyes watching your Kubernetes Cluster
Context
Once the Kubernetes cluster is set up and your application is up and running, we move on to the part where we keep a watch on the performance metrics. To ensure that everything is working as it is supposed to be working without any anomalies.
Application hosting is a complicated activity. A lot of things can go wrong when hosting an application. There are hundreds of minute things which can bring down your application and only the right monitoring solution can keep you ahead of them. More often than not the usual culprits are the basic ones:
1. Storage non-availability
2. CPU Usage Exhaustion
3. Memory non-availability
The monitoring that we set-up has to look-out for the above most fundamental performance issues on the Kubernetes Cluster at a regular frequency. An ideal monitoring solution would be that which can give us performance metrics in real-time, has an efficient alerting system and is detail oriented in a time-series based system.
Prometheus:
Prometheus is an open-source monitoring and alerting solution for your Kubernetes Cluster. It is so popular that it is almost synonymous with Kubernetes. If Kubernetes is your hosting solution, it is axiomatic that you use Prometheus for monitoring.
While AWS CloudWatch does offer a default monitoring solution at the AWS infrastructure level, Kubernetes components and application-level monitoring is better handled by Prometheus.
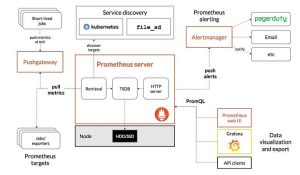
Using Time Series Database (TSDB), Prometheus records and stores pure numeric time series. Metrics, unique identifiers, and timestamps are collected, organized, and stored. It scrapes the HTTP endpoints of configured targets, like bare metal servers, databases, Kubernetes clusters, and applications that expose important metrics. It comes with its companion Alert Manager. However, on this project we have not used alerts from Prometheus and instead used the Alerting service on Grafana. Which we will see in detail a few paragraphs later.
Reference: <https://prometheus.io/>

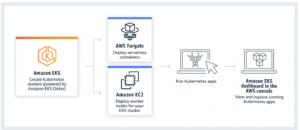
Installation on EKS:
The most easy and effective way of installing Prometheus on an EKS Cluster is by using a Helm Chart. After installing Helm on your Kubernetes Cluster, you just have to run the following commands in the sequence and voila your Cluster now has the top-notch monitoring solution installed.
helm repo add prometheus-community htt ps://prometheus-community.github.io/helm-charts
helm repo update
helm install prometheus prometheus-community/prometheus
Once the installation is complete, we have to expose the Prometheus service using node port on port 9090. This can be done using kubectl
kubectl expose service prometheus-server - type=NodePort - target-port=9090 - name=prometheus-server-extThe main functionality of the Prometheus server is to collect metrics from the cluster at a regular interval and store them in a time series DB. These metrics when viewed in a GUI gives a precise idea of how the cluster is functioning in a time-series format. This then can be used for creating a presentation layer for analysis.
Visualization is not one of the strengths of Prometheus and it becomes apparent the moment you first set sight on its GUI. To put it mildly, it is not as user-friendly as you would want it, nor does it allow you much customization of the presentation part. This is the reason why a lot of people prefer to use Grafana instead which is a fantastic tool that is better at Visualization and has amazing graphics making it an obvious choice.
Grafana:
Grafana is a very extensively used visualization and analytics tool. Data from your time-series database (TSDB) can be turned into graphs and visualizations. With the help of the tools we study, analyze and monitor data over a particular period of time technically known as time series analytics.
It offers a lot of flexibility in creating the dashboards and the tile panels with individual metrics inside the dashboards. It is immensely user-friendly and has a plethora of visualization graphs etc.

One of the greatest strengths of Grafana is its ability to bring metrics from different data sources together on a single platform. You have data from Prometheus, Loki, AWS CloudWatch agent, InfluxDB, Graphite and a myriad of other data sources which can be used in conjunction with each other. The result can be a remarkably clear picture of the performance metrics of your application deployment with all the data sources working in a symphony of sorts.
Installation :
There are two ways of using Grafana, we either create a server for Grafana on the Cluster itself by installing it using Helm and configuring it to be used from the Cluster and accessing it exactly how we did with Prometheus. The other way is to simply use the Grafana cloud. Which is exactly what we did for our project as it allows for saving some of our resources in the development environment.
Following are the steps to use Grafana Cloud.
- Register on https://grafana.com/
- Scroll to ‘manage your Grafana Cloud Stack’ and click on ‘Launch’ on the Grafana tab.
- Start building your dashboard.
After creating the Grafana cloud account we now need to add the data sources which we are using. Below is how we do it:
- Go to settings
- Click on ‘Add data source’.
- Select Prometheus and provide the service endpoint. Save the changes.
- Create a new Dashboard.
- Select your data source. (Prometheus in our case)
- Create dashboards selecting the metrics for which you would like the visualization.

Configure Alerts:
Alerts in Grafana can be set up using alert rules. We create rules which act as queries like CPU usage at 40% for example would be a query that could be the trigger. So whenever the CPU utilization on the cluster touches 40%, the alert is triggered and the contact points are sent messages as per configuration.
These queries can be configured as per client requirement. We had set up three alerts for the development environment.
- CPU utilization alert at 50% usage
- CPU usage at 70% usage
- Memory utilization at 40%
- Memory utilization at 60%
After the alerts are set-up, we need to create contact points to send the alerts. Grafana supports alerts to be sent to contact points via Slack, Email, Amazon SNS, Elastalert, Zabbix, Datadog, Pagerduty at this time.

One Response
Looks Good