Cloud computing has revolutionized the way organizations manage their IT infrastructure. With the benefits of scalability, reliability and cost savings, more and more organizations are moving their systems to the cloud. However, with this transition, the need for effective monitoring and management of cloud infrastructure has become increasingly important. This is where tools like Prometheus and Grafana come in, providing organizations with a powerful and flexible monitoring solution for their cloud infrastructure.
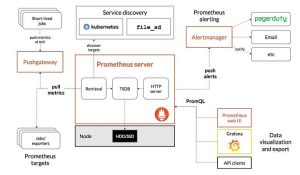
Prometheus is an open-source monitoring tool that provides a time-series database to store metric data and a query language to retrieve and process these metrics. It is designed to be highly scalable, allowing organizations to monitor multiple systems and applications simultaneously. The multi-dimensional data model and scraping mechanism in Prometheus make it easy to retrieve metrics from various sources and store them in the time-series database.
Grafana, on the other hand, is a popular open-source dashboard and visualization platform that integrates with multiple data sources, including Prometheus. It provides a flexible and intuitive interface for creating custom dashboards and alerts. With Grafana, organizations can visualize and monitor the health of their systems in real-time, providing valuable insights into the performance and health of cloud systems.
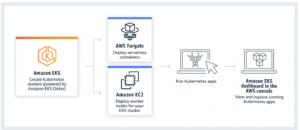
The steps to set up monitoring with Prometheus and Grafana on AWS are straightforward. The first step is to create an AWS EC2 instance, which can be done by launching an EC2 instance in the AWS management console. Once the instance is created, the next step is to install and configure Prometheus. This involves installing the Prometheus server on the EC2 instance and configuring it to scrape metrics from cloud systems.
Once Prometheus is installed and configured, the next step is to install and configure Grafana. This involves installing the Grafana instance on the EC2 instance and configuring it to retrieve data from Prometheus. After installation, organizations can create custom dashboards in Grafana to visualize the metrics collected by Prometheus. These dashboards can be customized to display various performance metrics and alerts, providing real-time visibility into the health of cloud systems.
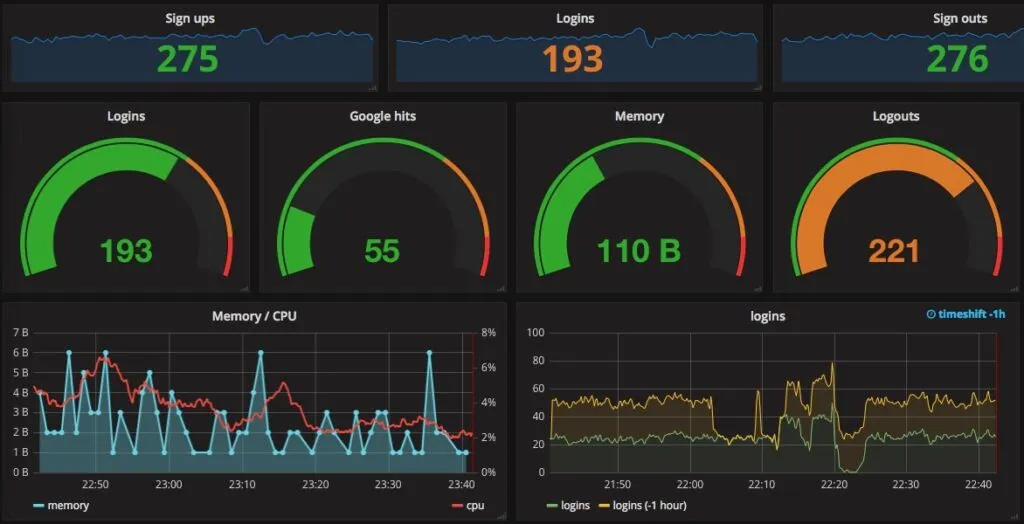
Finally, organizations can set up alerts in Prometheus and Grafana to receive notifications based on certain conditions being met. For example, an alert could be triggered if the CPU usage on a cloud system exceeds a certain threshold. This enables organizations to quickly respond to issues and prevent downtime.
In conclusion, monitoring cloud infrastructure with Prometheus and Grafana on AWS provides organizations with a powerful and flexible solution for ensuring their systems are operating optimally and effectively. By utilizing these tools, organizations can gain real-time insights into the performance and health of their systems, enabling them to respond quickly to issues and prevent downtime. With the scalability and reliability of AWS and the monitoring capabilities of Prometheus and Grafana, organizations can confidently manage their cloud infrastructure and ensure their systems are performing at their best.